
If we were to take a year-end snapshot of the performance of all types of investments (stocks, bonds, real estate, cash), there would always be an array of winners and losers. Sometimes stocks will outperform bonds by a wide margin, but the opposite has also been true. The dangerous part about looking at such a list, is that we might be tempted to wonder why we would own the assets that are at the bottom. I have often been asked: Why would I own bonds that return 3% when the stock market is up 20%? Or, why would I own emerging markets stocks when they are down 25% this year? Why should I invest in that when the returns of this are obviously better?
THIS IS WHERE A VISUAL TOOL CAN HELP PROVIDE PERSPECTIVE.
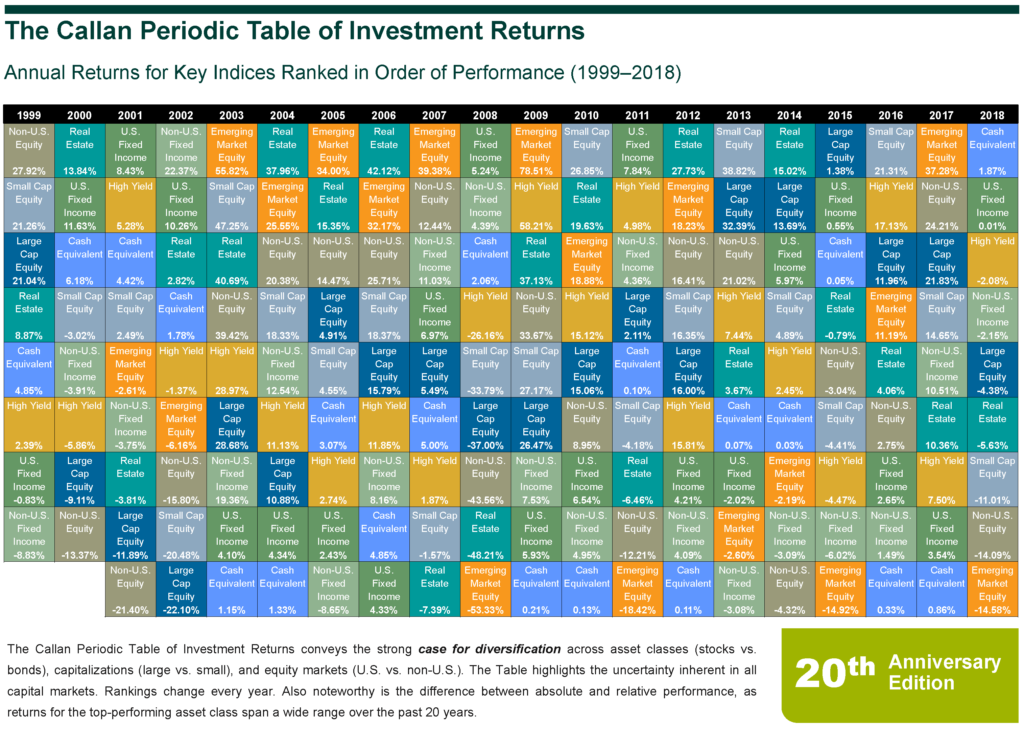
For 20 years, the research firm Callan has produced what they call The Periodic Table of Investment Returns. This visual tool tracks the performance of asset classes in ranked order year by year. They named it the Periodic Table because the colorful quilt resembles the Periodic Table of the Elements that successfully scared me away from Chemistry twenty years ago.
The time frame of the last 20 years is very interesting. While the stock market is much higher today than it was in 1999, the time period includes two bear markets. This allows us to see how risk and safe assets performed over different cycles. I have been using the Callan table and some of its variations with clients and investors to emphasize a few key points about investing that make sense, visually.
investment return observations
- The pattern of returns is random. There is no rhyme or reason to one asset performing better than another in any given year. Trying to pick the asset that would be on top each year is a fool’s errand.
- Diversify by owning some of each asset. Your job is not to pick the winners. As an investor, you want to find the blend of risk and safety that works for you.
- Cash is the most frequent last place finisher. It placed last 7 years out of 20. The only year it was at the top was 2018. Cash was also the only asset over the last 10 years to never have returns higher than inflation.
- Real estate and emerging market stocks are the most frequent winners. They got to the top via a roller coaster, though. They are the only assets to have one year drops of over 40% (2008).
The above observations are important. If you had put your money in the best asset (emerging market stocks) in the end of 2017, and moved out of the worst asset (cash), you would have lost 15% in 2018 and finished at the bottom of the rankings.
WHY SHOULD I INVEST IN ____?
This year and every year, it is impossible to take the information from the immediate past and apply it to the immediate future. It will lead to frustration and almost certainly lower returns. The Callan Periodic Table challenges us to understand the random nature of returns and embrace the need to be diversified across many different investment options. Diversification, along with costs and our behavior, is one of the few things that we can control as investors.
Why should I invest in ______, when it had such a bad month/year/decade? Because as the cycles change, each asset will have its day in the sun and provide necessary ballast when the leaders return to the pack. Questions about the diversification of your investment returns? I’d love to have a conversation. Contact me at [email protected].